My Portfolio
Explore my portfolio to know how I've turned complex data into meaningful insights, driving results across different projects and industries.
Get in touch instead ?

Explore my portfolio to know how I've turned complex data into meaningful insights, driving results across different projects and industries.
Get in touch instead ?
Each visualization here transforms raw data into compelling stories, highlighting key insights and trends.
These visualizations showcase my ability to distill complex information into clear, actionable visuals, using tools like Tableau and Power
BI to drive impactful decision-making
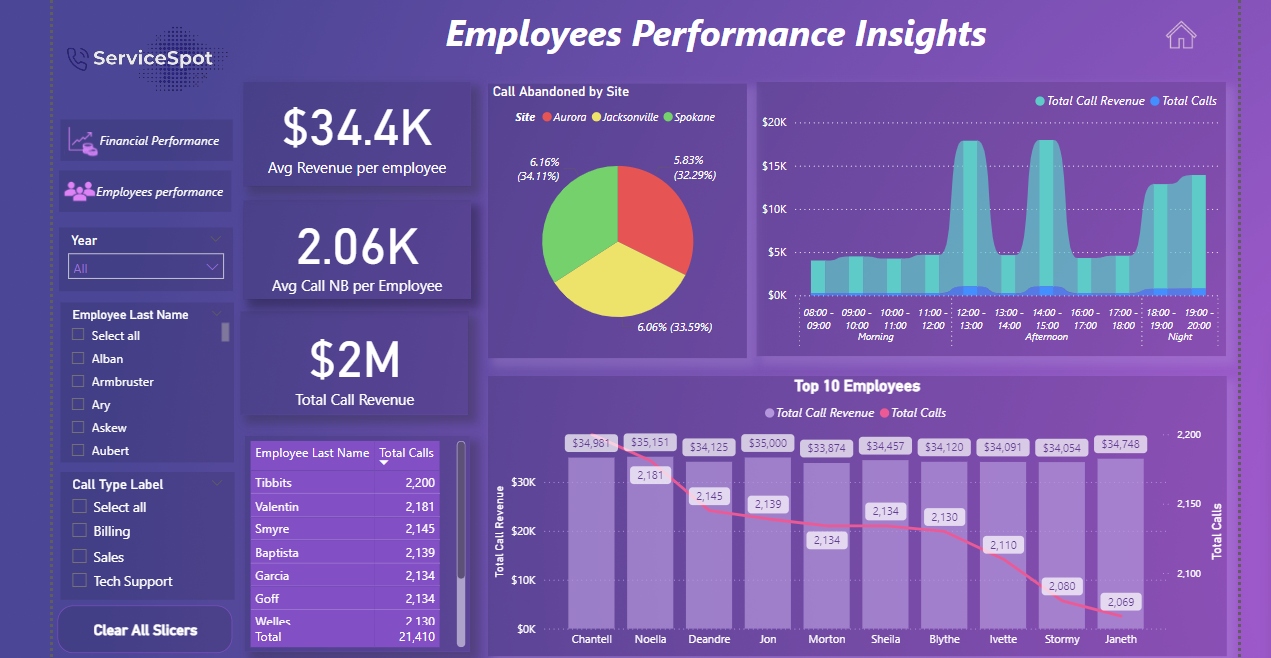
ServiceSpot Call Center Data Analysis
ServiceSpot, an IT company, needed help analyzing their call center data, which was scattered across multiple files. I used Power BI to consolidate the data and create visually appealing reports, enabling them to monitor key metrics like call volume, response times, and agent performance effectively.
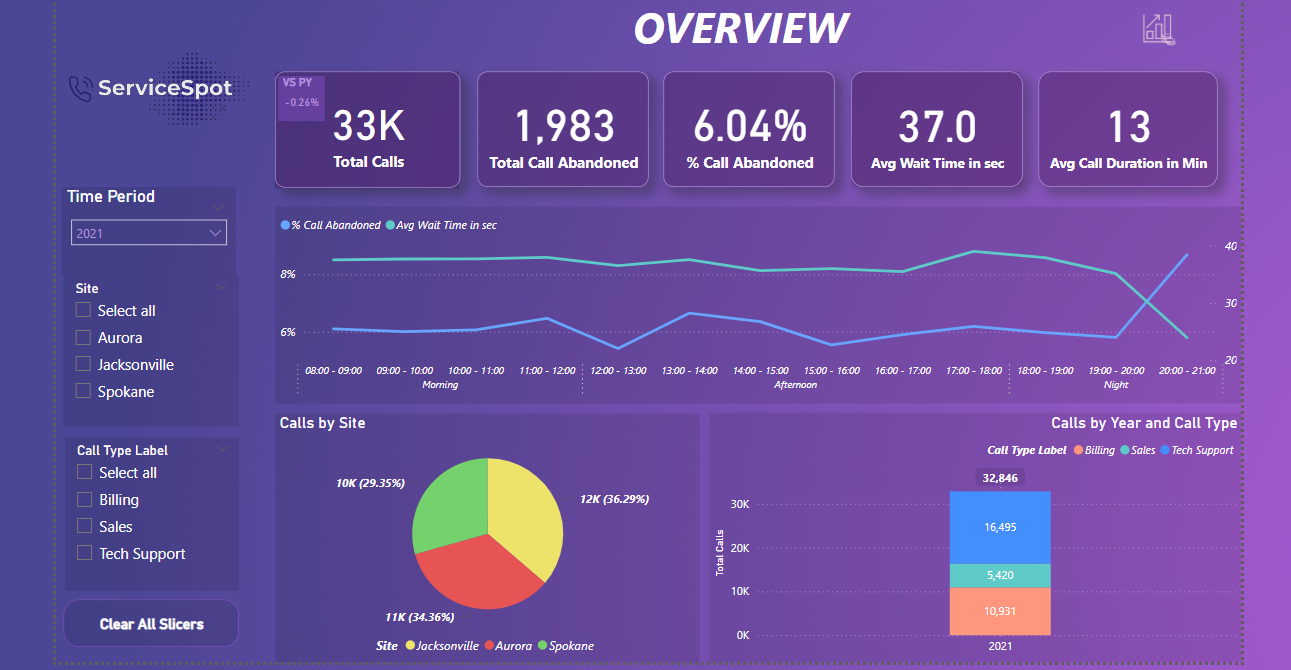
Data Consolidation: Combine fragmented data into a single, unified dataset.
Performance Monitoring: Track call center metrics through dynamic reports.
Visualization: Design intuitive dashboards for better decision-making.
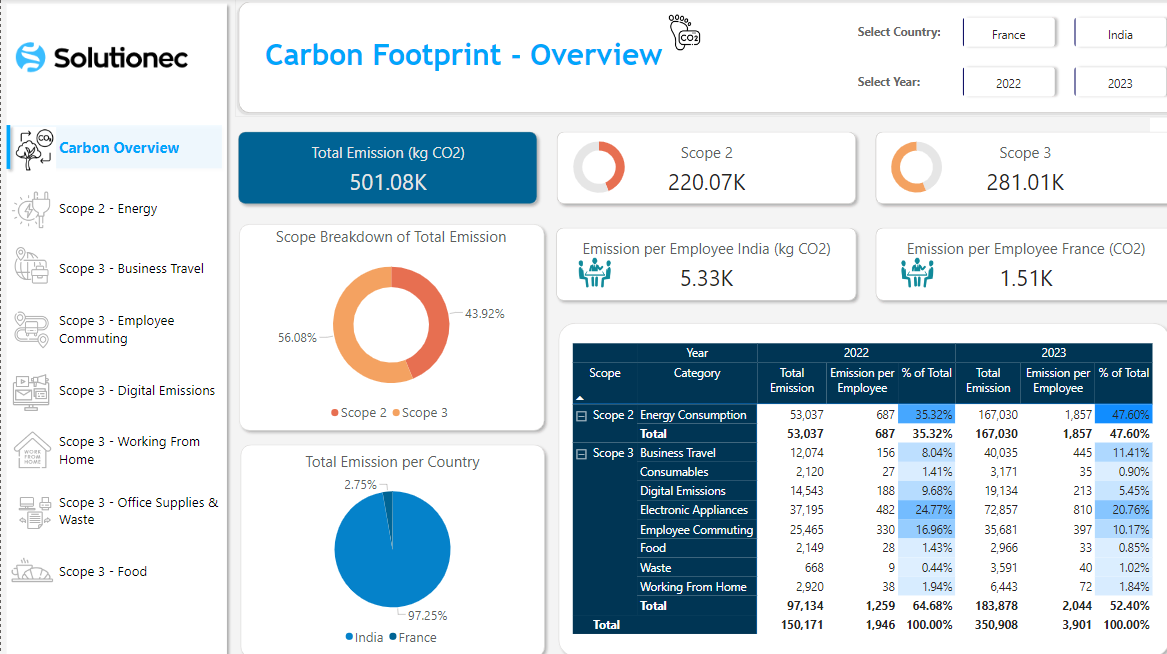
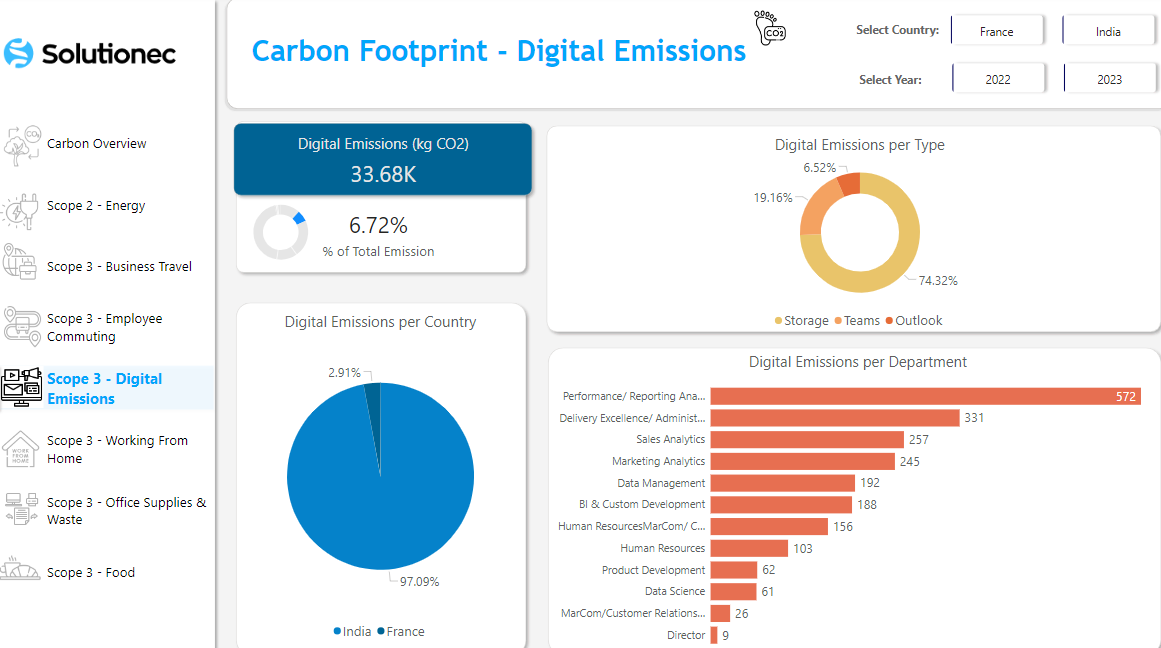
Carbon Footprint Project
The Carbon Footprint Reduction Initiative is a project I led with my team to quantify and reduce the environmental impact of our business activities through detailed data analysis and strategic actions.
Our focus was on assessing carbon emissions generated by various operations, calculating these emissions with precision, and identifying actionable insights to drive sustainable practices.
Stimedy Dashboard Enhacement
The Stimefy Dashboard project is focused on transitioning the existing Excel-based dashboard for tracking employee work hours in multiple projects to a more advanced and user-friendly platform using Power BI.
This project aims to improve data visualization, enhance decision-making capabilities, and streamline the tracking of time spent on various projects within Solutionec. The goal is to provide a comprehensive, real-time overview of Stimefy activities, making it easier for stakeholders to monitor and analyze productivity and resource allocation.
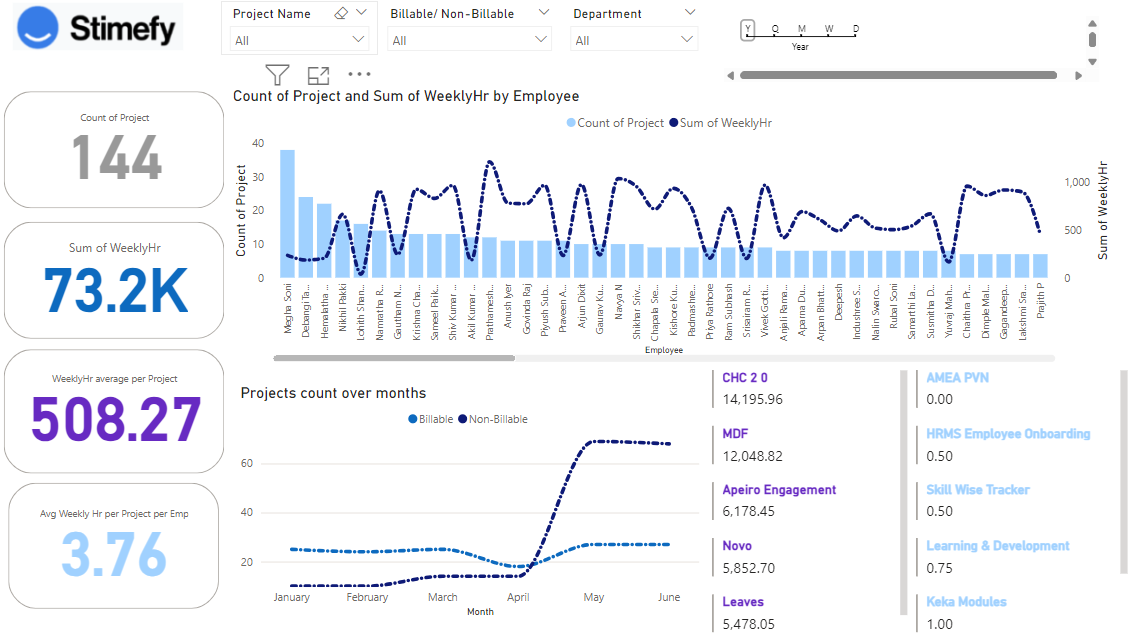
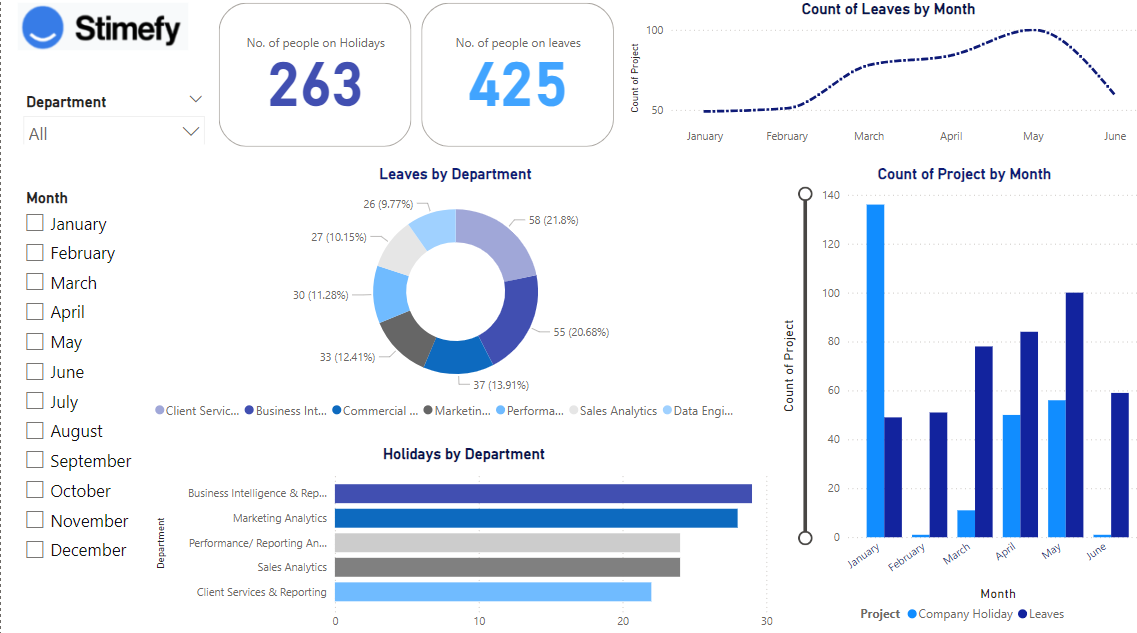
The goal was to assess the profitability of each employee and optimize resource allocation.
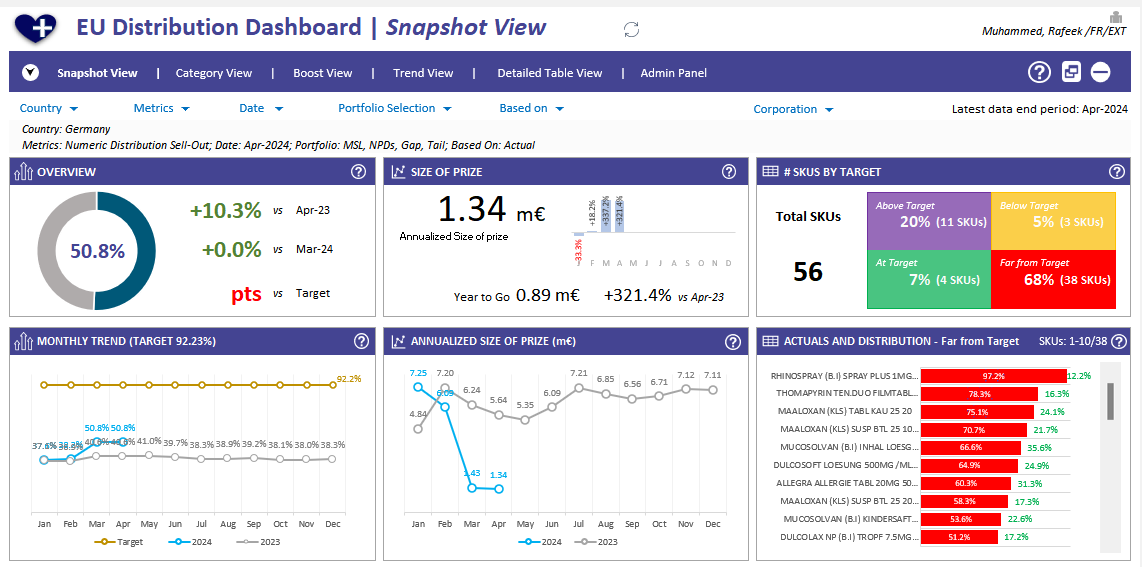
EU Distrubtion Dashboard
This is a dashboard showing the distribution of products in Germany. It shows the total number of SKUs sold, the annualized size of the prize, the monthly trend of sales, and the actuals and distribution of products by category.
The data is broken down by target (above, at, below, or far from) and by individual product.
This site was created with the Nicepage